Mynd:European Output of Books 500–1800.png

Page contents not supported in other languages.
Úr Wikiorðabók, frjálsu orðabókinni

Upphafleg skrá(1.436 × 953 mynddílar, skráarstærð: 64 KB, MIME-gerð: image/png)


Skrá þessi er af Wikimedia Commons, og deilt meðal annarra verkefna og nýtist því þar. Hér fyrir neðan er afrit af skráarsíðunni þar.

Lýsing

Lýsing
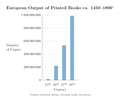
Deutsch: Geschätzte europäische Buchproduktion von 500 bis 1800. Bei den Manuskripten sind einzelne Urkunden und Chartas nicht berücksichtigt. Ein gedrucktes Buch ist definiert als ein Druckwerk von mehr als 49 Seiten.
English: Estimated European output of books from 500 to 1800. Manuscripts do not include individual deeds and charters. A printed book is defined as printed matter containing more than 49 pages.
Dagsetning
Uppruni

eigin skrá

Data from: Buringh, Eltjo; van Zanden, Jan Luiten: "Charting the “Rise of the West”: Manuscripts and Printed Books in Europe, A Long-Term Perspective from the Sixth through Eighteenth Centuries", The Journal of Economic History, Vol. 69, No. 2 (2009), pp. 409–445 (416–417, tables 1&2)
Höfundarréttarhafi Tentotwo
Aðrar útgáfur
This graph image could be re-created using vector graphics as an SVG file. This has several advantages; see Commons:Media for cleanup for more information. If an SVG form of this image is available, please upload it and afterwards replace this template with {{vector version available|new image name}}.


It is recommended to name the SVG file “European Output of Books 500–1800.svg”—then the template Vector version available (or Vva) does not need the new image name parameter.

LaTeX source

\documentclass[border=5mm]{standalone}
\usepackage{pgfplots}
\usepackage[super]{nth}
\usepackage{amsmath}
 
 
\pgfplotstableread{
Siglos Manuscritos Libros impresos
6       13552           nan
7       10639           nan
8       43702           nan
9       201742  nan
10      135637  nan
11      212030  nan
12      768721  nan
13      1761951 nan
14      2746951 nan
%15   4999161 12589000
16       nan            217444000
17      nan             531941000
18      nan             983874000
}\datatable
 
\definecolor{RYB1}{RGB}{128, 177, 211}
\definecolor{RYB2}{RGB}{253, 180, 98}
 
\begin{document}
\begin{tikzpicture}
\begin{semilogyaxis}[
        axis on top=false, grid=both, xmajorgrids=false, every minor grid/.style=gray!20,
        axis lines*=left,
        width=12cm, height=8cm, enlarge x limits=0.05,
        ymin=1000, ymax=1e9,ytick={1000,1e4, 1e5, 1e6, 1e7, 1e8, 1e9},
        yticklabels={1000, 10\,000, 100\,000, 1\,000\,000, 10\,000\,000, 100\,000\,000, 1\,000\,000\,000},
        enlarge y limits=false,
        ybar=-10pt, xtick={6,...,18}, xticklabel={\pgfmathparse{int(\tick)}\nth{\pgfmathresult}},
        xlabel=Siglos, xlabel style={yshift=-1ex},ylabel=Número\\ de Copias,
        ylabel style={rotate=-90, align=left, anchor=east, xshift=-4ex, name=ylabel},
        after end axis/.code={
                \node [
                        font=\large\bfseries,
                        text=RYB2!60!black, fill=white, fill opacity=0.85, text opacity=1,
                        anchor=center, inner xsep=1pt]  at (axis cs:11,5e3) {Manuscritos};
                \node [
                        font=\large\bfseries, inner xsep=1pt,
                        text=RYB1!60!black,
                        fill=white, fill opacity=0.85, text opacity=1,
                        align=center, anchor=center]  at (axis cs:16.6,5e3) {Libros impresos};\
        },
        title={Producción Europea occidental de libros entre los años 500 y 1800$^{\text{\tiny{*}}}$},
        title style={font=\large\bfseries, align=center}
        ]
 
        \addplot +[fill=RYB1, draw=RYB1!50!black] table [y=Books] {\datatable};
        \addplot +[fill=RYB1, draw=RYB1!50!black, /pgf/bar shift=2.5pt] coordinates {(15,12589000)};
        \addplot +[fill=RYB2, draw=RYB2!50!black] table {\datatable};
        \addplot +[fill=RYB2, draw=RYB2!50!black, /pgf/bar shift=-2.5pt] coordinates {(15,4999161)};
        \draw (rel axis cs:0,0) -- (rel axis cs:1,0);                 
\end{semilogyaxis}
\node (annotation) at (current axis.below south west) [inner xsep=0pt, anchor=north west, align=left, font=\tiny] {$^*$without Southeast Europe (Byzantine, later Ottoman realm) and Russia};
 
\end{tikzpicture}
\end{document}

Leyfisupplýsingar:

I, the copyright holder of this work, hereby publish it under the following license:
w:en:Creative Commons
tilvísun höfundarréttar Deila eins
Þessi skrá er með Creative Commons Tilvísun-DeilaEins 3.0 Óstaðfært notkunarleyfi.
Þér er frjálst:
  • að deila – að afrita, deila og yfirfæra verkið
  • að blanda – að breyta verkinu
Undir eftirfarandi skilmálum:
  • tilvísun höfundarréttar – Þú verður að tilgreina viðurkenningu á höfundarréttindum, gefa upp tengil á notkunarleyfið og gefa til kynna ef breytingar hafa verið gerðar. Þú getur gert þetta á einhvern ásættanlegan máta, en ekki á nokkurn þann hátt sem bendi til þess að leyfisveitandinn styðji þig eða notkun þína á verkinu.
  • Deila eins – Ef þú breytir, yfirfærir eða byggir á þessu efni, þá mátt þú eingöngu dreifa því verki með sama eða svipuðu leyfi og upprunalega verkið er með.

Captions

Add a one-line explanation of what this file represents

Items portrayed in this file

depicts enska

15. desember 2011

Breytingaskrá skjals

Smelltu á dagsetningu eða tímasetningu til að sjá hvernig hún leit þá út.

Dagsetning/TímiSmámyndVíddirNotandiAthugasemd
núverandi22. desember 2011 kl. 02:41Smámynd útgáfunnar frá 22. desember 2011, kl. 02:411.436 × 953 (64 KB)TentotwoRemoved source text from image
16. desember 2011 kl. 03:53Smámynd útgáfunnar frá 16. desember 2011, kl. 03:531.455 × 953 (73 KB)TentotwoImproved formatting
15. desember 2011 kl. 00:38Smámynd útgáfunnar frá 15. desember 2011, kl. 00:381.260 × 799 (87 KB)Tentotwo

Það eru engar síður sem nota þessa skrá.

Altæk notkun skráar

Eftirfarandi wikar nota einnig þessa skrá: